Биологические науки
Tree ring based summer precipitation reconstructed for South Western Tian Shan Mountain in Tajikistan since 1790-2016
Saltanat Sabitova 1,2, Ruide Yu1,2,*, Zulfiyor Bakhtiyorov3,4, Assiya Massakbayeva1,2, Botagoz Issina1,2
1 State Key Laboratory of Environment Change in Arid Lands, Xinjiang Institute of Ecology and Geography, Chinese Academy of Sciences, 818 South Beijing Road, Urumqi 830011, Xinjiang, China.
2 University of Chinese Academy of Sciences, 52 Sanlihe Road, Beijing 100864, China.
3 Laboratory of Introduction and Dendroindication of Plants, Khujand Science Center, Academy of Sciences of the Republic of Tajikistan. 735714 Khujand, north-eastern Industrial Zone
4 Faculty of Geoecology, Department of Ecology and Environmental Protection, Khujand State University named after B. Gafurov. 735700 Khujand, st. Mavlonbekova 1.
*Corresponding Author: Yu Ruide, yuruide@sina.com;
ABSTRACT: Our study was motivated by insufficient data on dendrochronological studies limited to the northwestern part of Tajikistan due to the lack of access to such a remote part of the country. Current studies in South Western Tian Shan Mountain have revealed that a reconstruction of climate change based on tree chronologies of Juniper (semiglobosa and seravschanica) tree species are possible. A 227-year tree-ring chronology was constructed and analyzed from cores collected in Shahristan. We presented a reconstruction of summer precipitation (June-August), covering 1790-2017, which is in good agreement with pale climatic data, and also reflects the main climatic changes in the study area.
Key words: South Western Tian Shan Mountain, tree-ring chronology, juniper, Shakhristan.
Introduction
The chronology of tree rings has been widely used to reconstruct climate change during the growing season over centuries and millennia(Frank et al. 2010; Foster and Rahmstorf 2011). However, climate information in the rings can be analyzed individually to give an idea of what the climate was in the past and how it is likely to be characterized in the near future(Fritts 1976). The population history of many tree species in Europe and North America, compared to other continents such as Central Asia, is relatively well studied. There are many studies on the reconstruction of temperature, precipitation, drought, associated with the width of the ring of juniper trees.
In Tajikistan, interest in dendrochronology was briefly touched upon by A. V. Gursky in the 30s of the last century, but it did not have any success(Chen et al. 2015). Later in the same XX century, Soviet scientists made a series of works on radial growth of trees, in the XXI century very little research in the field of aridity, earthquake reconstruction and climatic connections of ring chronology, and in the Turkestan Ridge there are also no reconstructions that would explain climatic anomalies and in order to fill this gap in knowledge, we studied the changes in the growth of the width of the annual rings from core, hemispherical juniper (J. Semiglobosa) and zerafshan juniper (J. Seravschanica) tree trunks from Shahristan, Sughd region, northern Tajikistan. This study is the first of its kind reconstruction based on tree-ring chronology of 1790-2016, which also shows wet and dry periods for northern Tajikistan over 227 years. This study is also important because it is the first study in this part of the Turkestan Range.
Materials and method
Sampling area
The northern ridges of the Pamir-Alai system are the Alai and Turkestan ranges, bordering the Fergana Valley from the south. The duration of drought in the mountains is much less than on desert plains, only August and September are sharply arid. During the expedition work in the autumn of 2016, at an altitude of 2900-3000 m above sea level. m, north-west direction at an angle of 10-45 ° from Sughd region (TPA 39 ° 34 ‘- 39 ° 40’N / 68 ° 50’ — 68 ° 43’E), Tajikistan, (Figure 1) of the Pamir-Alay mountains, Shahristan (TPSH), for the dating and measurement of the characteristics of the radial growth of wood, cores were taken mainly on 2 radii of 5 mm diameter. In total, 37 cores were collected from 17 non-rotten or damaged living trees. After being transported to the laboratory, they were carefully dried, then they were pasted on a wooden base, and then polished and polished. For dating, we used the full package of standard norms (Stokes and Smiley 1968; Fritts 1976; Pilcher 1990). To minimize non-climatic effects on tree growth, only trees with no injury or disease were sampled. Tree height ranged from 8 to 12 m depending on site conditions; the diameter ranged from 144 to 345 cm.
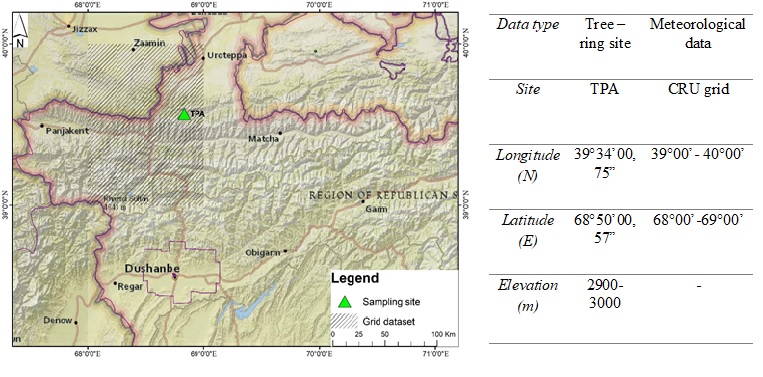
Figure 1. Map showing the two tree-ring sampling sites and the gridded dataset in Southwest of Tian Shan Mountain (Tajikistan) and Information about the sampling site
For recording and identifying drop-down and spurious rings, a measuring semi-automatic installation LINTAB VI was used together with the TSAPWin Scientific 4.80 program with an accuracy of 0.01-0.05 mm. In order to estimate within which segment of the compared curves the greatest and what is the magnitude of the possible shift, we used the program COFECHA v 6.06. We used ARSTAN 41d to remove the effect of endogenous stand disturbances and apply an estimate of the function of the mean value based on the use of negative exponents and linear regression. The quality of the chronology we constructed was based on traditional dendrochronological indicators — the standard deviation SD (characterizing the amplitude of the climatic variability of growth), EPS — showing the relationship of tree-ring chronology to changes in external climatic parameters, RBAR — average correlation among tree-ring series, MS evaluating the sensitivity of chronology to external changes (Cook, E L; Kairiukstis 1990; Opała et al. 2017).
Analysis of meteorological data
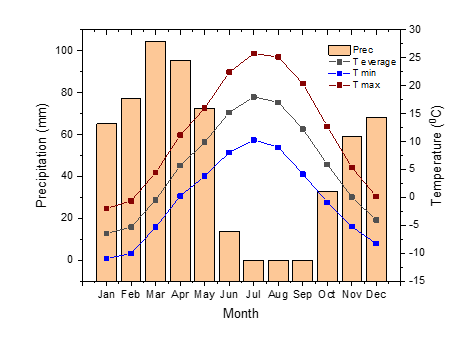
Figure 2. Climate diagram (Tajikistan) interpolated to sampling site from gridded dataset (1950-2016)
Meteorological data has shown that climate of the study area is characterized by very scarce summer rainfall. The gridded monthly precipitation and mean/max/min temperatures data from near Sampling area were received with covering the period of 1950 to 2017 (average over 39°00 –40°00 N, 68°00- 69°00 E,) were received from the Climatic Research Unit (CRU TS 4.00), East Anglia, UK database (CRU.)(CRU.). Mean annual precipitation is 580 mm, with maximum monthly precipitation in early spring (February, March, April and May). Summer period (July-August) is a high-temperature period, with highest maximum temperature existent in July at 25.8ºC and coldest month is January with a minimum air temperature -10.9ºC (Fig. 2). At altitudes of 1500-3500 m, the climate has the characteristic features of the mountain, it is cooler and more humid in the majority of the territory.
Tree-ring growth and climate trends
The summary statistics of the standard chronology produced by standardization program ARSTAN (Figure 3). The mean sensitivity (0.274) show low correlation, with significant standard deviation (0.291), these reflect good responses to the variation of climate (Cook & Kairiukstis 1990). Mean correlation with master series is 0.171 (Table 1). Reliable ring-width chronology spanning 1760-2016 was developed based on an EPS value ≥0.85.
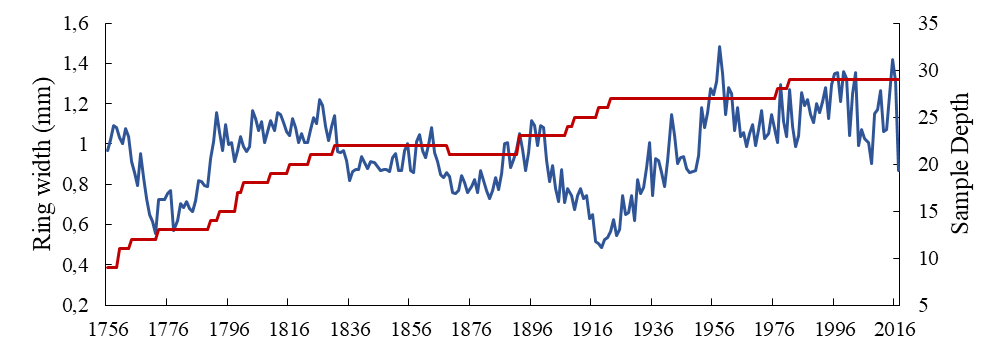
Figure 3. the chronology measurements of samples and their corresponding sample depths at the site (TPA)
Table 1.
Statistics for the standardized tree-ring chronologies used in this study
| Type of tree- ring width | Mean sensitivity | Mean correlation | Standard deviation | signal-to-noise ratio | expressed population signal | EPS>0.85 | Core/tree number | |
| Junipers | 0.274 | 0 .171 | 0.291 | -0.111 | -0.125 | 1760 | 30/17 | |
Climate response analysis
Figure 4 depicts the significant coefficients for correlation functions. Coefficient correlation between standard chronology and gridded precipitation significant p<0.001 from the prior June-October period. Figure 4a shows the correlation between ring-chronology and instrumental data (temperatures and precipitation) for the period 1950-2016. The correlation coefficient between the instrumental average/min/max temperatures and the radial increment showed a positive effect in January (r<0.320, p <0.01) and negative in November (<0.250, p <0.05), this is probably due to the retention of moisture, i.e. January, which has a beneficial effect on tree growth, as it prevents the possibility of moisture evaporation. We also found good connections to precipitation in June (0.404, p <0.001), and negative in October (-0.272, p <0.05), probably due to the limitation of humidity occurring in the middle of the current season.
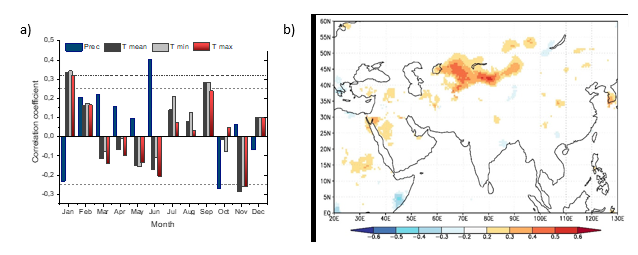
Figure 4. a) The correlation coefficients between standard chronologies of the North Western Tian Shan Mountain with the monthly sum of precipitation, monthly mean/max/min temperatures of the CRU dataset. The dotted (p<0.05) and dashed (p<0.001) lines indicate significant variables. b) The spatial correlation between tree ring-width and summer precipitation of CRU gridded date during 1950–2016 (Tajikistan)
Based upon our correlation estimates is scarce with precipitation in both points of meteorological data, positive correlation just in prior January and September (CRU grid dataset) with average/min/max temperature, it determines drought area in this part of Tajikistan (Treydte et al. 2004; Fang et al. 2012). Precipitation also plays a significant role in causing drought stress which is demonstrated by higher correlation coefficients with precipitation than temperature (Opała et al. 2017).
Deficiency of water in the growing season suppresses the expansion of tracheids. Also, with increasing temperature, evaporation increases in June-September due to low precipitation, which accelerates water stress (Fig. 16). When the tracheid’s become narrower, the proportion of the cell wall in the annual ring increases due to a decrease in the size of the lumen (Pant et al. 2000). In fact, this connection reflects short and intense interactions (high frequency signals) between precipitation and monsoon deposition. These findings suggest that consistency of climate variations in radial growth has increased during the latter half of the twentieth century due to global warming.
We conducted spatial correlation between our precipitation reconstruction (Tajikistan) and the gridded precipitation dataset of HadlSST1 (Rayner et al. 2003) for the period 1950-2016 (Fig. 4b). The good positive correlations of the summer precipitation reconstructed related to the CRU grid dataset good connections between the precipitation in the southern Tian Shan Mountains and in the remote ocean area. The positive areas of correlation were found close to the research area (Chen et al. 2014) and negative in north of Tian Shan.
Characteristics of reconstruction based on ring width
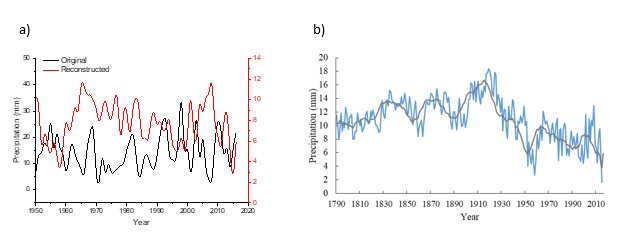
Figure 5. (a) Comparison between original and reconstructed July–September precipitation over 1950-2012 (Tajikistan). (b) Reconstruction of summer precipitation and 10-year simple smoother moving average.
Table 2.
Results of regression model statistics for calibration test results Tajikistan
| Year | Correlation coefficient (r) | Correlation square (r2) | Reduction of error | Coefficient of efficiency | Sign test | Durbin-Watson |
| 1950-2016 | 0.404 | 0.164 | 8.368 | 0.054 | 18—/29+ | 2.073 |
Based on the results of correlation coefficient analyzes, summer precipitation is most suitable for climate reconstruction. By calculating the regression relationship between the TPA chronologies with summer precipitation of CRU grid data, the precipitation of these months for the period of 1790 to 2017 was reconstructed. (Fig. 5b). For the estimated verification of the constructed reconstruction of the course of these precipitations, we compared them with the data of instrumental observations at the meteorological station for the period from 1950 to 2016. (Fig. 5a). The results of the regression dependence were as follows — the correlation coefficient R = 0.404, p <0.001, we also got an equation for our reconstruction:
Y =-18,8*X+29,11
where Y is the sum of the June-August sedimentary reconstruction and X is the standard chronology.
Results of regression model tests were further employed to evaluate the statistical fidelity of our reconstruction model, exceed the 95% confidence level(Table 2). The values of the two most rigorous tests of model validation, the reduction of error (RE) and the coefficient of efficiency (CE) are both positive, which indicates significant skill in the tree-ring estimates. These test results demonstrate the validity of our regression model. On the basis of this model, the local history of temperature in the study area has been reconstructed for the period 1840–2017 A.D. (Fig. 5b).
During reconstruction we considered dry and wet years, years / periods, the table below indicates the extreme years that were found in 1952, 1955, 1958, 1904, 1905, 1910, 1920, 1924 and 1999. Dry periods/decades with a lower value from the average rainfall were found in 1860, 1970, 1960, 1980 and 2000. Wet periods/decades with a higher value from the average precipitation amount were found in 1870, 1910, 1920, 1930 and 1940. Year / period characteristics were based on a sedimentary reconstruction with a smoothed filter, where smoother transitions are visible, rather than random jumps. Periods with long terms means: three wet fifty years 1790-1849, 1850-1899, 1990-1949, and one dry period, which fell in 1950-2017.
Spectral analysis and Spatial correlations
High-frequency peaks 1.1-year (95%), 0.9-year (99%) and 0.5-year (99%) relate to the range of variability the Western and Tibetan plateaus (Figure 6a)(Pederson et al. 2001). Therefore, these high-frequency cycles suggest that precipitation variability in our area of research may have strong associations with large-scale ocean and atmosphere circulation systems (Glueck & Stockton, 2001; Allan et al. 1996). But low-frequency cycles and multi-decade cycles of 78.6-year (99%), 16.6-year (99%), relate to the total width of the winter North Atlantic oscillation, which indicates the influence of these fluctuations on the climate of Central Asia(Hoyt et al. 1997; Glueck and Stockton 2001). However, the mechanism of influence of these circulation systems and how they control climate variability in Tajikistan at different times, is awaiting further study.
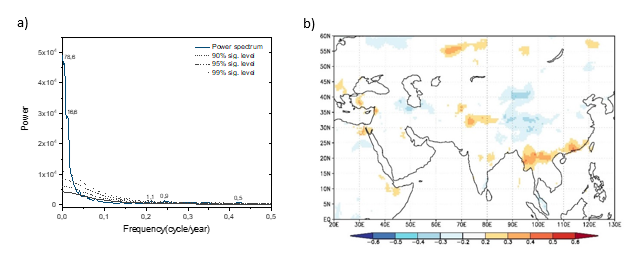
Figure 6. MTM spectral densities of Shahristan precipitation reconstruction. The dash, dash-dot and dotted lines represent 90, 95 and 99% significance level, respectively. The bold line indicates the null hypothesis. (b) With the gridded surface precipitation in South Western Tian Shan Mountain data set with reconstructed precipitation
To find the connection between our reconstruction and the geographical representation. We used spatial correlation between instrumental data spanned 1950-2012 (Fig.6b). The positive correlation showed that the research area is closely connected with east and west of Tajikistan and in particular South Tien Shan Mountains.
Conclusion
We tend to assume that a mean correlation between the tree-ring and the summer climate is probably related to the moisture limitation occurring in the middle of the current growth season. Although February-April is the most plentiful season of rain and we didn’t find any strong and significant correlations. The precipitation of Shahristan is low and highly variable and in warm regions with low altitude and a large interannual change in precipitation lead to a decrease in both temperature and soil moisture, which leads to a sharp growth of the tree during the heavy rainy season.
The good positive correlations of the summer precipitation reconstructed related to the CRU gid dataset good connections between the precipitation in the southern Tian Shan Mountains and in the remote ocean area. These low frequency cycles and multidecadal cycle 78.6-year (99%) relate to the total width of the winter North Atlantic fluctuation, which indicates the influence of these fluctuations on the climate Asia. However, the mechanism of influence of these circulation systems and how they control the temperature variability of Tajikistan at different times, awaits further study.
Acknowledgements
This study was supported by Xinjiang key research project (2016B02017-4) and the Project of Thousand Youth Talents (Y672141). Data collection and analysis were supported by the Research Center for Ecology and Environment of Central Asia, Chinese Academy of Sciences. Special thanks to “high-level talents project” (Y871171) of Xinjiang Institute of Ecology and Geography, Chinese Academy of Sciences.
Reference
Allan R, Lindesay J, Parker D (1996) El Niño southern oscillation & climatic variability. CSIRO publishing
Chen F, He Q, Bakytbek E, et al (2015) Climatic signals in tree rings of Juniperus turkestanica in the Gulcha River Basin (Kyrgyzstan), reveals the recent wetting trend of high Asia. Dendrobiology 74:
Chen F, Yuan Y, Wei W, et al (2014) Precipitation reconstruction for the southern Altay Mountains (China) from tree rings of Siberian spruce, reveals recent wetting trend. Dendrochronologia 32:266–272
Cook, E L; Kairiukstis LA (1990) Methods of Dendrochronology
CRU. Climatic Research Unit CRU TS4.00. http://www.cru.uea.ac.uk.
Fang FC, Steen RG, Casadevall A (2012) Misconduct accounts for the majority of retracted scientific publications. Proc Natl Acad Sci 109:17028–17033
Foster G, Rahmstorf S (2011) Global temperature evolution 1979–2010. Environ Res Lett 6:44022. doi: 10.1088/1748-9326/6/4/044022
Frank DC, Esper J, Raible CC, et al (2010) Ensemble reconstruction constraints on the global carbon cycle sensitivity to climate. Nature 463:527. doi: 10.1038/nature08769
Fritts HC (1976) Tree Rings and Climate (Academic, New York). doi: 10.1126/science.198.4315.399
Glueck MF, Stockton CW (2001) Reconstruction of the North Atlantic oscillation, 1429–1983. Int J Climatol A J R Meteorol Soc 21:1453–1465
Hoyt D V, Schatten KH, Schatten KH (1997) The role of the sun in climate change. Oxford University Press on Demand
Opała M, Niedźwiedź T, Rahmonov O, et al (2017) Towards improving the Central Asian dendrochronological network—new data from Tajikistan, Pamir-Alay. Dendrochronologia 41:10–23
Pant S, Andre DL, Watson G, et al (2000) Computer system with user-controlled relevance ranking of search results
Pederson N, Jacoby GC, D’Arrigo RD, et al (2001) Hydrometeorological reconstructions for northeastern Mongolia derived from tree rings: 1651–1995. J Clim 14:872–881. doi: 10.1175/1520-0442(2001)014<0872:hrfnmd>2.0.co;2
Pilcher JR (1990) Sample preparation, cross-dating and measurement. Methods Dendrochronology Appl Environ Sci 40–51
Rayner NA, Parker DE, Horton EB, et al (2003) Global analyses of sea surface temperature, sea ice, and night marine air temperature since the late nineteenth century. J Geophys Res Atmos 108:
Stokes MA, Smiley TL (1968) 1968: An introduction to tree-ring dating. Chicago: University of Chicago Press
Treydte K, Welscher C, Schleser GH, et al (2004) The climatic signal in oxygen isotopes of junipers at the lower timberline in the Karakorum, Pakistan. Tree Rings Archaeol 2:100–106


