


Problem statement. Economy is spread unevenly throughout the space, as well as population. Economic growth is closely related to processes of territorial concentration, urbanization and agglomeration, which are intensified in conditions of globalization. However, excessive concentration of population and economic activity in a single centre causes a range of undesirable consequences – congestion, environmental pollution, social tension etc.
Analysis of latest researches and publications. Matters of spatial development, concentration and agglomeration have been studied deeply by a number of scientists: A. Marshall, M. Porter, P. Krugman etc.; a number of researches on polycentricity has been conducted by E. Meijers, P. Veneri, N. Green. Ukrainian scholars have also made a significant contribution to regional development studies: Z. Varnaliy, V. Popovkin, S. Romaniuk, V. Chuzhykov etc.
Unsolved parts of general problem. The patterns and trends of spatial polycentricity have been examined well for the developed countries. However, the full picture of the problem also requires analysis for countries with lower levels of development.
Purpose of the article. The key aim of the article is definition of polycentric development trends in Ukraine in comparison with developed countries – members of OECD.
Research results. Spatial patterns of population and economy distribution are formed by complicated interaction of many factors which foster agglomeration or dispersion. P. Krugman defines them as “centripetal” and “centrifugal” forces respectively [6]. The former ones include economies of scale, market size effects (forward and backward linkages), transport costs, while high rent prices, immobility of certain production factors and negative agglomeration externalities constitute the latter. Therefore, theoretically spatial distribution of economy could have two extreme states: absolute concentration in a single mega-city, or totally even dispersion throughout the territory. In reality, both mentioned states are extremely unlikely; as a rule, territorial development pattern is a mix of larger and smaller settlements. Depending on prevailing type of forces – centripetal or centrifugal – territorial development can be characterized as predominantly monocentric (concentration in the largest city) or predominantly polycentric (distribution between several cities or towns which do not differ in size significantly).
General indicator of territorial economic concentration is economic density, which can be defined as “the economic mass or output generated on a unit of land” [11, p. 49]. As a rule, density level of a city (town, village) corresponds with its place in the settlement hierarchy: highest density for primary cities, lesser for second-tier cities and small urban centres etc. However, measuring density straightforwardly as economic output (GVA) of a settlement divided by its administrative area may distort the results because of local factors (surface relief, urban planning regulations etc.). Approaches to solve this problem include defining maximum density level with the help of spatial density grids [11, 5, 9], or adjusting density mathematically to be more proportionate to settlement hierarchy level [17].
The most widely used indicator of polycentricity is distribution of largest cities by their size. According to rule of urban hierarchy known as Zipf’s law, the population of any city is equal to the population of the largest city, divided by the rank of the city within the country’s urban hierarchy. In equation form, Zipf’s law looks as follows:
![]() , (1)
, (1)
where R is rank of a given city by its size; S – city population; β – slope of regression line. Absolute value of β quotient approximately equals 1. However, not all countries’ urban hierarchies strictly follow the mentioned law, and more polycentric countries have higher absolute values of β quotient [1].
In addition to rank-size distribution indicator, one can also measure the significance of the largest centre for the studied area. OECD experts use the so-called “primacy rate” indicator, which is calculated as the share of population in the most populated city over total population [1, p. 10]. Other researchers interpret primacy rate as the deviation of largest city population from the rank-size regression line (the latter being plotted without the largest city) [ESPON].
Developed to measure polycentricity in terms of population, rank-size rate and primacy rate can also be applied to economic indicators, such as income or gross value added. Though population and economic density are generally highly correlated, they can change at different speed and direction, what means they cannot be substituted by one another without controlling the level of economic development (GDP per capita) [17].
Disparities in GDP per capita between largest city (cities) and rest of country’s area can also serve as relative measure of economic concentration. It is a common situation for most of the countries, as agglomeration benefits foster higher productivity and innovation by mechanisms of “sharing, matching and learning” [3]. But a very large gap may indirectly signify severe inequalities in standards of living between metropolitan areas and smaller settlements.
Like in most European countries, the most populated city of Ukraine is its capital, Kyiv. By the beginning of 2015, it occupied 836 km2, which is 0.14 % of total Ukrainian national area; population of the city was 2 888 thousand people (6.7 % of country total and 9.7 % of urban population) [18, 19]. According to UN World Urbanization Prospects 2014, in 2010 only 8 countries of 151 covered by the report had lower shares of urban population in their largest cities, among them Italy (8.7 %), Netherlands (7.3 %), Poland (7.3 %) and Germany (5.6 %) [14]. The 12th annual edition of Demographia World Urban Areas estimated population density in Kyiv at 7200 people per km2, which is 391-th place among world cities by this indicator; it is significantly higher than in European capitals (e.g., London – 5600 people per km2, Sofia – 6400 people per km2) [2]. Therefore, in the medium-term perspective, Kyiv has potential to grow further without serious agglomeration diseconomies (OECD defined a threshold of 6-7 million people, after which there is negative correlation between city size and its GDP per capita level) [10, p. 30-31].
The picture is different in economic dimension: in 2014 Ukrainian GDP per capita was 36 904 hryvnias ($ 8,665.5 PPP by World Bank estimates), but in Kyiv it amounted 124163 hryvnias, or 236 % higher than national average [1912]. Having 6.7 % of Ukrainian population, the capital generated 22.5 % of country GDP. In developed countries, such disparity usually does not exceed 50 %; at the same time, in low-income countries, it can reach 300-400 %. Such a gap indicates that innovative activities and high value-added production are mostly concentrated in the largest city, while economy in the rest of country area is extremely inefficient (most probably, based on agriculture and primitive manufacturing).
The difference in GDP per capita between Kyiv and other large cities is also rather significant: in 2014 it was more than twice higher than in two next largest cities – Kharkiv and Odessa. So, even in comparison with other centres of agglomeration, Kyiv remains dominant by economic indicators. Rank-size plots of demographic and economic dimensions of Ukrainian urban hierarchy (Figure 1) reflect the disparities in GDP per capita mentioned above. The gap between lines representing population and GDP is highest for Kyiv and becomes more narrow as size of cities diminishes.
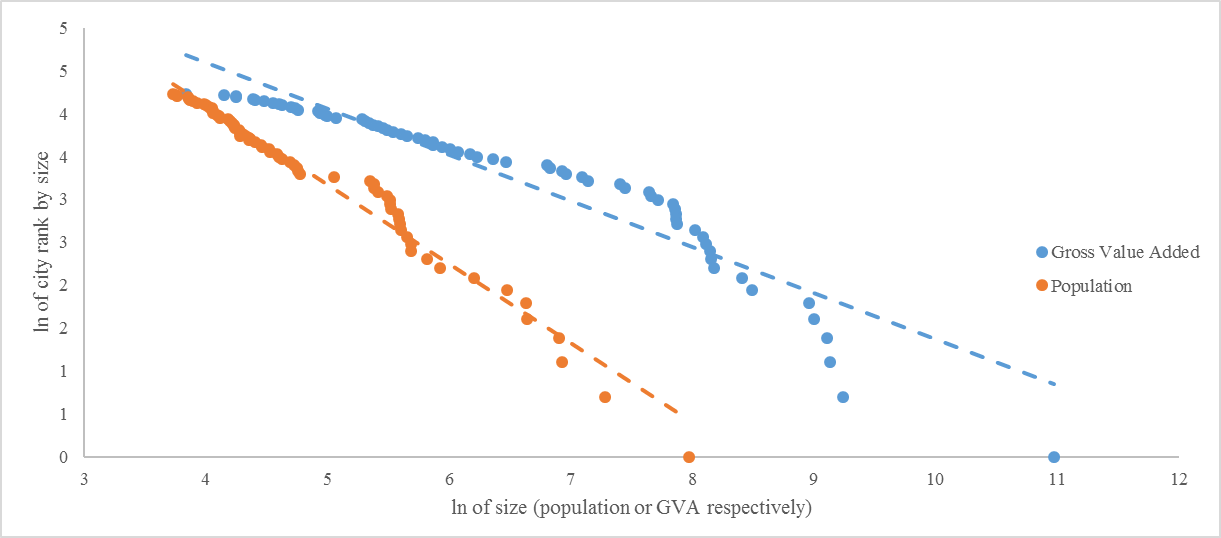
Figure 1. Rank-size distribution of Ukrainian cities by population and GDP, 2014
Moreover, while population rank-size plot almost coincides with its trend line, the economic one has more noticeable deviations. Largest cities – Kyiv, Kharkiv, Odessa and Dnipro (former Dnipropetrovsk) – are situated well below the trend line; thus, we can possibly expect them to grow faster than rest of the cities, further increasing the GDP per capita gap.
So, Ukraine can be defined as quite a polycentric country in terms of population and significantly more monocentric economically. More robust conclusions can be made by comparing Ukraine with other countries. Although comparing both with developed and developing countries would be more illustrative, for the latter ones the availability of reliable cities’ GDP data is very limited. Therefore, Ukraine was compared with OECD countries, which have detailed statistics of metropolitan areas’ population and GDP for 2001-2014.
For international comparisons of polycentricity levels, rank-size and primacy rates defined above were used. Both rates were computed for demographic dimension (based on population of cities) and economic one (based on cities’ GDP). Number of cities used to compute rank-size rate depends on available data, but not less than 4 and not more than 10 to ensure adequate estimations. To consider long-term dynamic of polycentricity, two years were taken: 2001 and 2014 (2012 for OECD GDP-based indicators). Comparison results are summarised in Table 1 [15, 8].
Table 1
Changes of polycentricity indicators in Ukraine and OECD countries, 2001-2014
| Country | Number of largest cities covered | Population | Economy | ||||||
| 2001 | 2014 | 2001 | 2014* | ||||||
| rank-size | primacy | rank-size | primacy | rank-size | primacy | rank-size | primacy | ||
| Australia | 6 | 0.699 | 21% | 0.740 | 21% | 0.667 | 22% | 0.699 | 20% |
| Belgium | 4 | 0.959 | 22% | 0.921 | 23% | 0.667 | 31% | 0.672 | 31% |
| Canada | 9 | 0.912 | 18% | 0.887 | 20% | 0.911 | 20% | 0.869 | 19% |
| France | 10 | 0.836 | 19% | 0.840 | 19% | 0.709 | 29% | 0.705 | 31% |
| Germany | 10 | 1.645 | 5% | 1.548 | 5% | 1.289 | 5% | 1.376 | 5% |
| Italy | 10 | 0.852 | 7% | 0.835 | 7% | 0.785 | 10% | 0.756 | 12% |
| Japan | 10 | 0.586 | 26% | 0.582 | 28% | 0.545 | 31% | 0.550 | 32% |
| Korea | 10 | 0.655 | 43% | 0.632 | 49% | 0.647 | 46% | 0.649 | 46% |
| Mexico | 10 | 0.801 | 18% | 0.837 | 17% | — | — | 0.694 | 23% |
| Poland | 8 | 1.256 | 8% | 1.268 | 8% | 0.979 | 15% | 0.973 | 16% |
| Spain | 8 | 0.884 | 14% | 0.857 | 15% | 0.738 | 18% | 0.721 | 19% |
| The Netherlands | 5 | 1.165 | 14% | 1.187 | 15% | 1.127 | 16% | 1.139 | 16% |
| Ukraine | 10 | 1.147 | 5% | 1.113 | 7% | 0.828 | 17% | 0.802 | 22% |
| United Kingdom | 10 | 0.852 | 18% | 0.824 | 19% | 0.724 | 26% | 0.700 | 28% |
| United States | 10 | 1.283 | 6% | 1.390 | 6% | 1.358 | 8% | 1.385 | 8% |
For 2014, Ukraine has shown relatively high level of polycentricity by population with rank-size rate of 1.113 which is 5-th high among 15 countries covered (after Germany, United States, Poland and the Netherlands). In economic dimension it occupied the 6-th position from the top (after above-mentioned countries and Canada). Primacy rate by population for Ukraine is among the lowest, and in economy it is close to median value (20 %).
During 2001-2014, GDP primacy rate of Ukraine grew the fastest compared to OECD countries – at about 0.4 percentage point per year, although respective rank-size rate decline (which means more monocentricity) was slower than in Canada and Italy. Unlike Ukraine, where economic concentration was fastest in a single city – Kyiv, in the mentioned countries it was spread between several largest metropolitan areas.
An approach to evaluate territorial concentration trends within a single country in a more detailed way was proposed by S. Romaniuk [17]. It is based on measuring long-term (10 or more years) change of population density and economic density in given areas of same territorial level (region, district, city etc.). Depending on mutual direction of changes, each examined area can belong to one of four quadrants:
I quadrant: both population density and economic density increase. It usually indicates stable, agglomeration-driven growth;
II and IV quadrants: population density falls and economic density rises and vice versa. It is a risky situation which signifies continuing specialisation processes within the area that may lead to temporary increase in productivity.
III quadrant: both population density and economic density decrease. Such dynamic is associated with economic downfall of the area, especially in case of GDP per capita reduction (which means that economy falls faster than population).
Figure 2 demonstrates growth trends of Ukrainian cities with population above 40 000 inhabitants. Most of regional administrative centres (which are at the same time largest cities in respective regions) have their economy increased, except Dnipro (former Dnipropetrovsk) where GVA density decreased at -4 %; 67 % of mentioned cities suffer from depopulation.
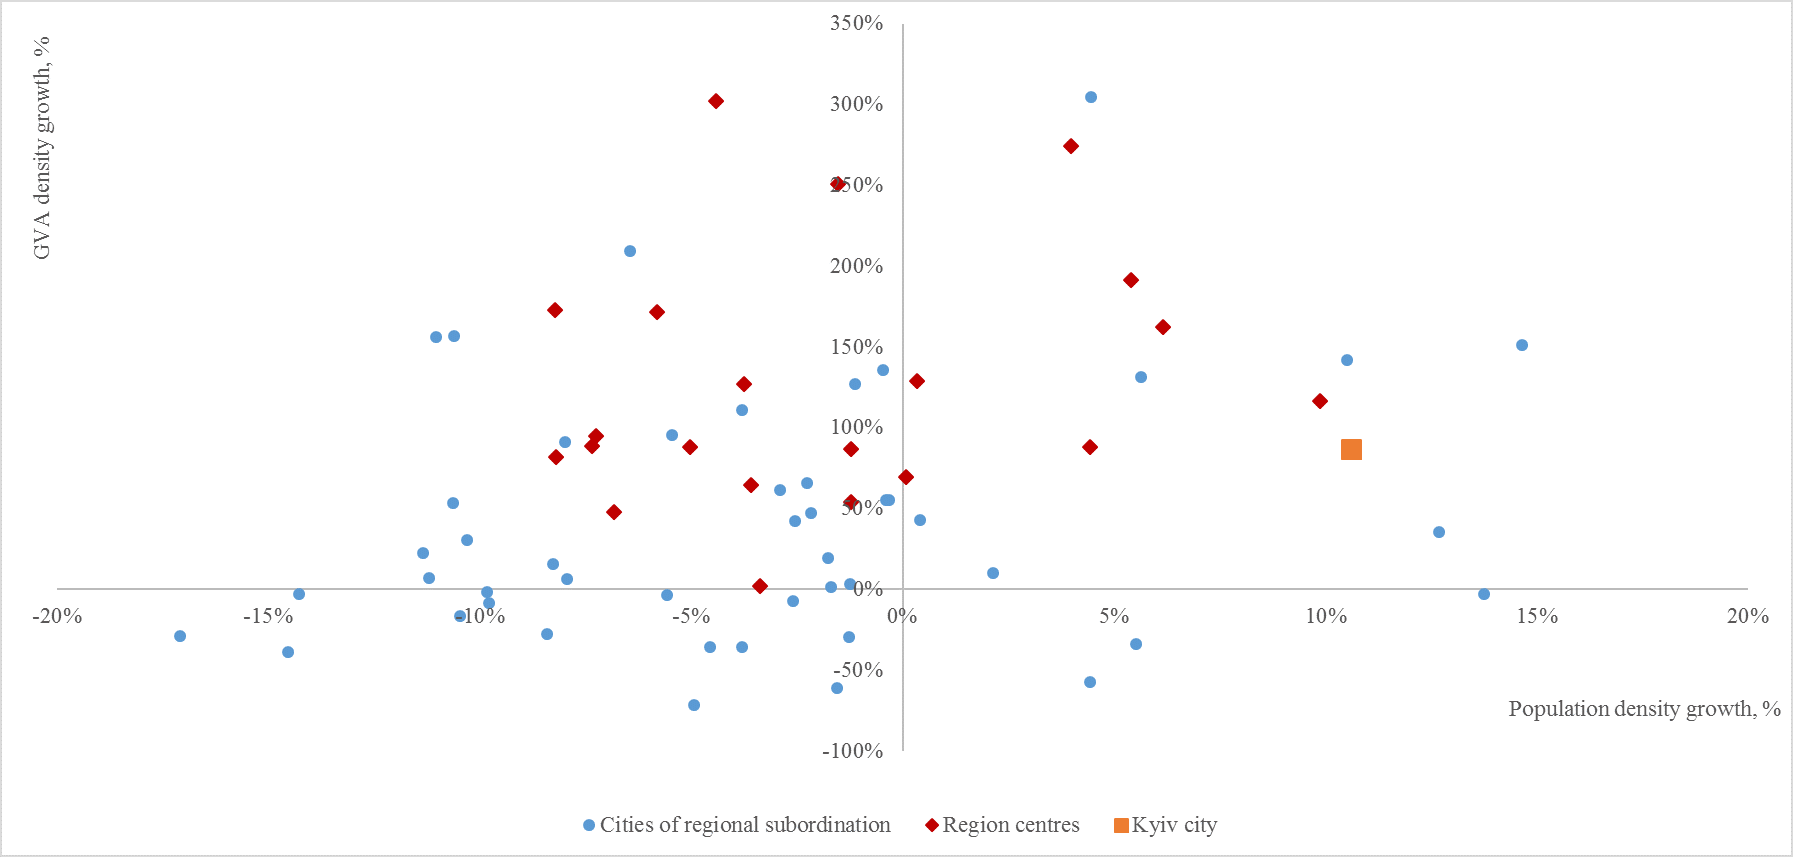
Figure 2. Population and GVA growth in Ukrainian major cities, 2001-2014
As for cities of regional significance, only 9 of them (11 %) fall into upper right quadrant; 2 of them –Boryspil and Brovary – are located in Kyiv region and so are able to utilise agglomeration benefits from being near the capital. On the other hand, 15 cities (28 %) have negative dynamic by both dimensions, what makes them necessary objects of targeted regional policy measures.
The capital’s economic and population densities grow steadily, outrunning most of other Ukrainian cities. This is one more evidence of monocentric development trend in Ukraine. Some particular cities grew faster, but their economic mass is generally too low to change the hierarchy significantly.
Similar plot for the United States shows quite different results (Figure 3, based on data from [13]). A lion’s share of cities falls into first quadrant, demonstrating sustained growth. Even for decreasing areas, negative dynamic does not exceed 10 % for population and 15 % for GDP, while some of Ukrainian cities’ economies have halved for 14 years. So, from this point of view, pattern of spatial development in the United States can be defined as more polycentric, complying with positive changes in rank-size rates (see table 1).
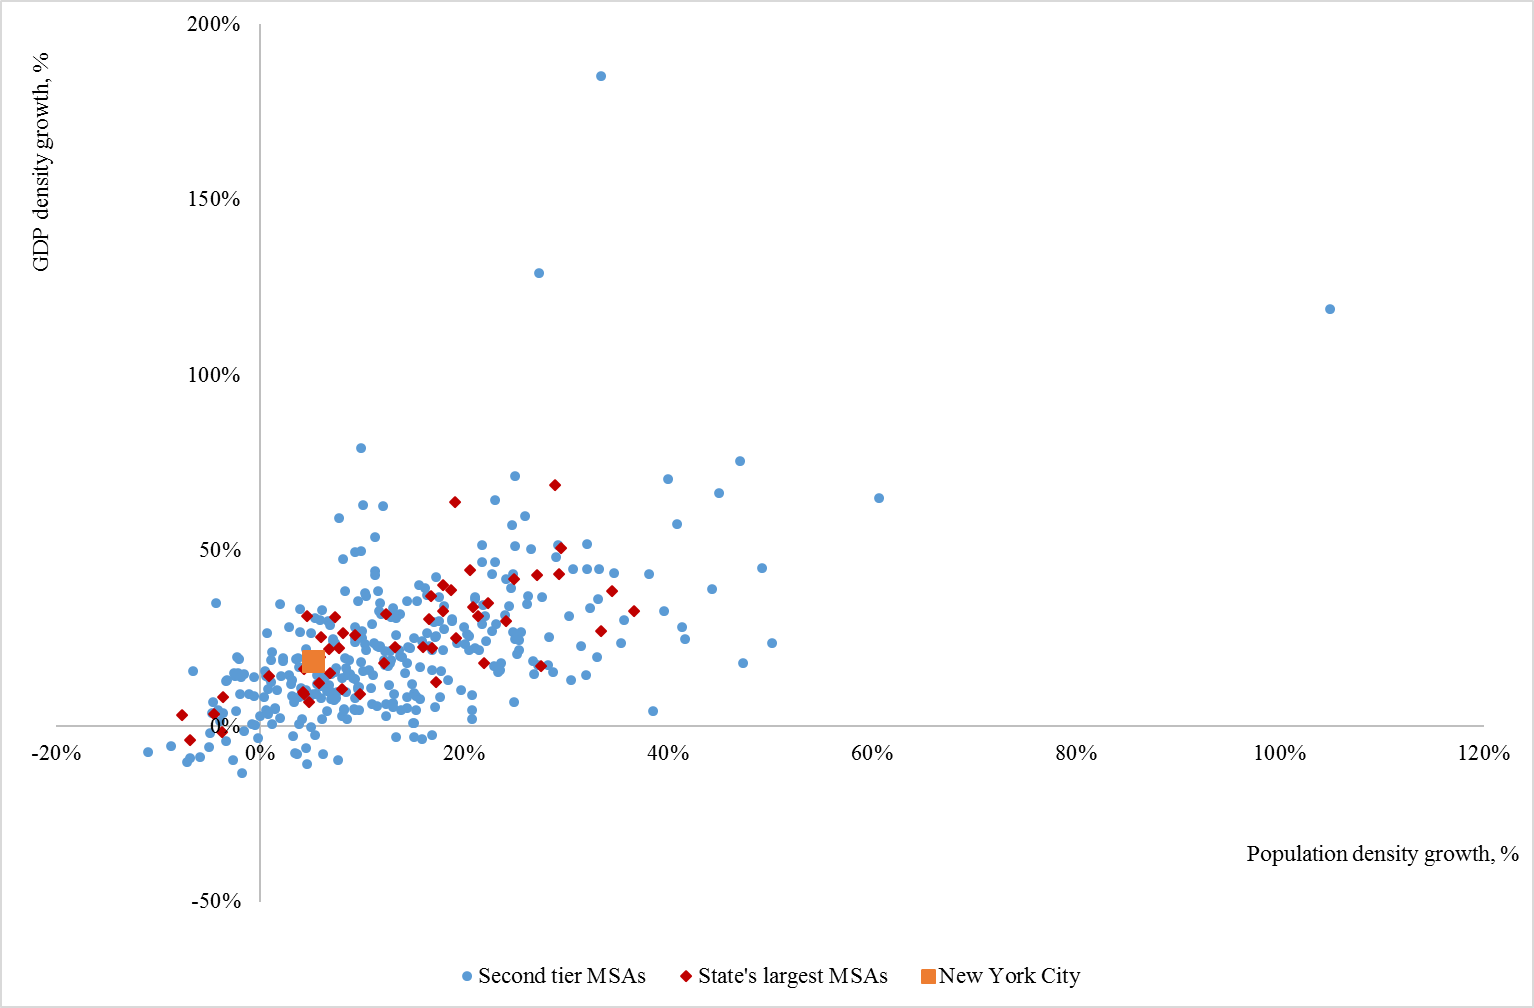
Figure 3. Population and GDP growth in USA metropolitan areas, 2001-2014
More polycentric structure of a country allows bigger part of the territory to benefit from being close to at least one large city [1]. “Distance to density”, by World Bank terminology, is crucial for towns and especially rural areas, where lack of connective infrastructure can hamper development. Research of changes in territorial structure of Ukrainian economy has shown that more than 30 % of Ukrainian rural districts (“rayons”) suffer rapid depopulation and economic downfall simultaneously, and only 15 of 490 districts experienced stable “first-quadrant” growth (all of them situated near the capital or region centres) [16]. In this paper, a similar approach is applied to OECD TL3 regions that mostly correspond to subnational territorial units.
Figure 4 shows that remote rural regions tend to have lower growth rates and are more prone to depopulation. The share of TL3 where both economy and population have fallen is 18 % for remote rural regions, but for the rural ones that are close to a city, the share is only 9 %, and 5 % for intermediate TL3. On the other hand, share of TL3 where economic density decreased (regardless of population density change), is slightly larger for rural regions close to a city than for remote ones (21.6 % and 19.1 % respectively). Most probable explanation to this phenomenon is suburbanisation and / or competition between suburb and city if the former is service-oriented [7].
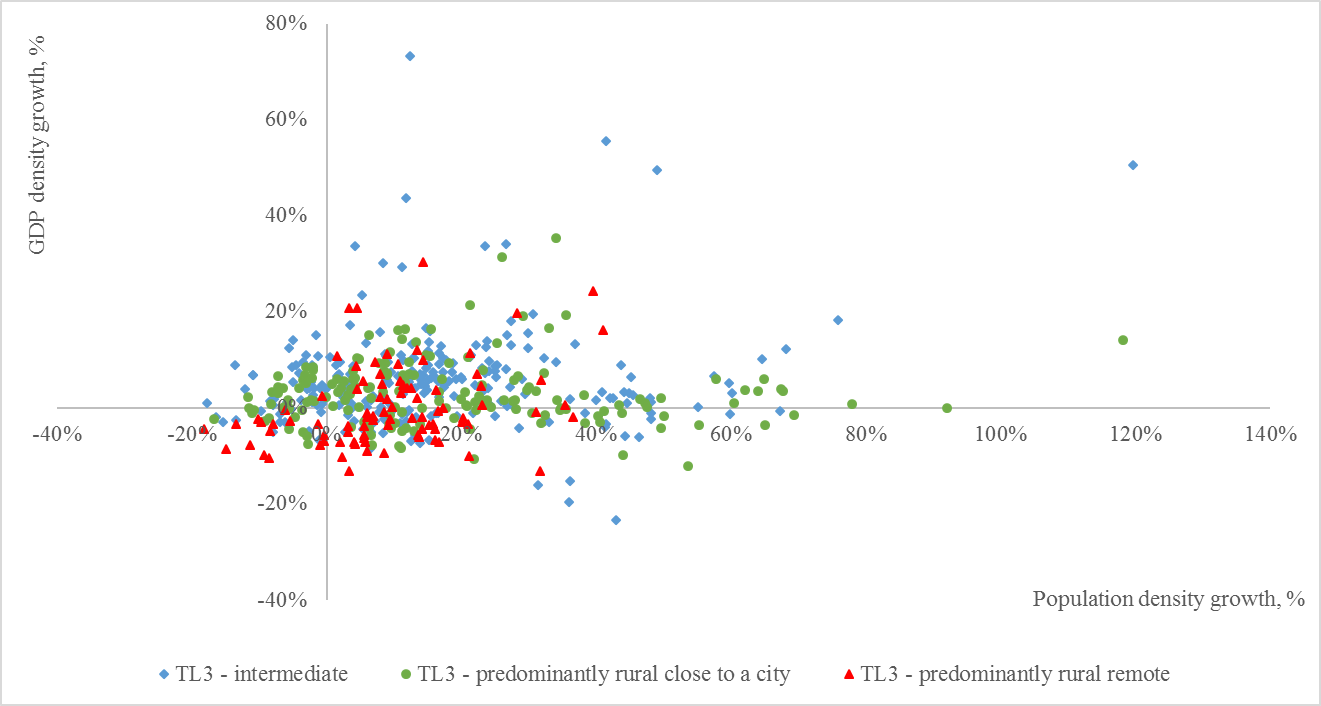
Figure 4. Population and GDP growth in USA metropolitan areas, 2001-2014
The empirical evidence from OECD countries complies with Ukrainian study mentioned above, and emphasises the importance of maintaining adequate infrastructure to extend agglomeration benefits, this way enhancing positive effects of polycentric development.
Concluding remarks. The research conducted in this paper has shown that Ukraine is a rather polycentric country in comparison with OECD members. However, it faces a strong monocentric trend of spatial development which is accompanied by depopulation of numerous towns and rural areas.
Examining long-term mutual dynamic of economic and population density changes allows to obtain a more detailed view on polycentricity of development on the national scale, allowing to define areas of agglomeration growth, as well as the ones that require targeted regional policy interventions. Applied to OECD TL3 regions, it has shown their better dynamic compared to Ukrainian districts; still, some of them most probably require additional infrastructural support in order to prevent further downfall.