- Introduction
The Storage Area Networks (SANs) are designed to manage large volumes of data for a large number of users. However, with the data growth problem optimise query performance and the issuance of the requested data. The most promising way to solve this problem — the use of statistical methods, in particular, the methods of queuing theory.
For evaluating the performance of storage networks as a queuing system are encouraged to apply stochastic models of polling or survey ordered [1,2]. The order is determined by polling the queue the next queue server selection rule. The most common order of the survey [2 – 4]:
— cyclic — set sequence of passage of queues;
— periodic — based on a survey carried out on the polling table;
— casual;
— priority.
In [5] it is noted that from a practical point of view of the significant interest of the system with an adaptive mechanism of polling, in which when polling queues considered state of the queue, that is, if the queue was empty in the polling cycle, the next cycle of the survey, this place will be skipped. However, this approach can only be used in polling systems where requests stream is stationary ergodic process [4,6]. Consequently, it is necessary to take into account the current value of unsteadiness particular queue. Therefore, in practice it is advisable to apply the polling mechanism of feedback and adaptation not only to the current size of the queue, but also to increase the speed (frequency) queue. Such problems do not occur in the sources available to us any general terms, nor in particular in relation to systems of the polling. Besides it’s necessary to meet the challenges of the current state of the forecast.
This paper attempts to fill this gap.
- The mathematical description of the polling system
Model of polling system for the storage area network is described as follows. The system has one server and N ![]()
queues. Each of the N buffers has a limited amount of memory in L cells. The call on service received in general non-stationary input flow. The non-stationary input flow of calls with the distribution function ![]() and the instantaneous intensity
and the instantaneous intensity ![]() goes in the kth queue. The maximum number of calls for the same observation interval
goes in the kth queue. The maximum number of calls for the same observation interval ![]() is equal
is equal ![]() , and
, and ![]()
![]() . In a survey of the kth element of the storage network
. In a survey of the kth element of the storage network ![]() calls are serving. We suppose that the time of service calls in the queue are independent and identically distributed with distribution function
calls are serving. We suppose that the time of service calls in the queue are independent and identically distributed with distribution function ![]() , which is continuous and differentiable, with the expectation
, which is continuous and differentiable, with the expectation ![]() and the second initial moment
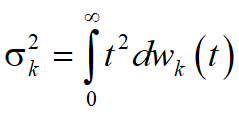
and the second initial moment  . The integral is understood in the sense of Stieltjes. It is assumed that the flow of calls and duration of service calls are mutually independent processes. Server visits queues, following the order of the selected polling and servicing them in accordance with the chosen discipline. Timeserver to connect to the kth queue is a random variable with density function, expectation and the second initial moment . The current length of the kth queue of calls, the buffer size (number of cells) is equal to L. The service time is random variable with mean and variance . During the kth queue length of the calls served.
We introduce some additional notations:
![]() — estimating interval the parameters, whose duration is significantly shorter than the duration of the observation interval ;
— estimating interval the parameters, whose duration is significantly shorter than the duration of the observation interval ;
![]() — instant rate of the interval estimation;
— instant rate of the interval estimation;
![]() — the probability that a call from the incoming flow will be directed to kth queue;
— the probability that a call from the incoming flow will be directed to kth queue;
![]() — the part of the calls served at the maximum possible load queue;
— the part of the calls served at the maximum possible load queue;
![]() — the average number of visits to the k-th line at a polling cycle;
— the average number of visits to the k-th line at a polling cycle;
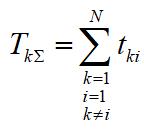
 — the average total time of switching from the k-th line on the i-th turn of the acquisition cycle.
The route service in polling system with non-stationary flow calls with the distribution function and the instantaneous intensity is embedded Markov chain [6], which states are characterized by transitions from the kth queue to the ith queue with probabilities , . If the condition
 , (1)
, (1)
where is the expectation of switching time from the kth queue to the ith queue is completing on the interval of observation , the average queue length of the interval of observation will take some finite, albeit non-stationary value (remind that we have the condition ).
If the condition (1) is not satisfied:
 , (2)
, (2)
then the probability of an unlimited increase in the total length of the queue ![]() will tend to unity (with some of the queues may have a fixed length, or even decrease).
will tend to unity (with some of the queues may have a fixed length, or even decrease).
III. Polling system with dynamic regulation of the queue length
Polling systems as the ordered polling system essentially are special queuing systems with priorities. However, to assign priority call (or query group) must take into account not only the class of the call, but the average time spent in the system queries. To find the average waiting time is most often used a weighted sum of the average waiting time , by which we mean the amount of
 , (3)
, (3)
where ; ![]() — Average time of service calls in the kth queue;
— Average time of service calls in the kth queue; ![]() — the average waiting time in the kth queue, the amount equal to the average switching times the and the total average time of service calls in other queues equal
— the average waiting time in the kth queue, the amount equal to the average switching times the and the total average time of service calls in other queues equal ![]() . This assumes that the calls are served by default in accordance with the discipline of «first come — first served» (FCFS).
. This assumes that the calls are served by default in accordance with the discipline of «first come — first served» (FCFS).
We can assume without any loss of generality, that the processes of queuing system and service processes are stochastically equivalent, i.e. having the same characteristics, stationary or non-stationary. In this sense, the polling system is statistically uniform.
Let the instantaneous duration of the kth queue is for continuous polling system or for discrete polling system. Accordingly, the instant rate of change of the length of the queue is the derivative of the queue length for a continuous system. For a discrete system we get the finite difference![]() . In the future, we consider discrete polling system.
. In the future, we consider discrete polling system.
Consider the problem of optimising the average service time of calls to the storage network. Take the weight coefficients of efficiency of product of medium length kth queue of its growth rate:
 , (4)
, (4)
where E — a symbol of expectation.
Thus, we come to the problem of minimising the functional additive to the measure of the polling system parameters:
 ,(5)
,(5)
where ![]() — the parameter vector, which minimizes the functional Y; T — the symbol of transposition.
— the parameter vector, which minimizes the functional Y; T — the symbol of transposition.
Thus, the minimisation of the functional (5) reduces to the non-linear convolution of criteria, which are used as weights . The frequency of calls to a particular line depends on the value of the product (4).
Now let’s conduct an analysis of the methods of prediction of parameters and state of SAN by various regression methods.
- A comparative analysis of the accuracy of prediction
Dissolving the problems of the current network management requires a systematic approach. Criteria for optimisation of key network performance parameters and the current network management are ambiguous and contradictory. Taking into account these contradictions and the search for compromise solutions possible by using statistical methods, harmonization of authenticity and detail the original data with the physical meaning of tasks.
Processes of parameters changes, on the one hand, they are essentially non-stationary, and the other — the trend of their changes is very similar. It is therefore of interest to study the characteristics of their stochastic correlation. This interest has not only theoretical but also practical. The main characteristics of the stochastic relationship use multiple correlation coefficient and multiple regression [8,9]. In addition, to automate measurements and calculations necessary to choose a method of approximation curves repeatable KPI changes. The most flexible and accurate method is the approximation by polynomials on a minimum mean square error [10,11].
Consider the problem of predicting kth variable in the variables of process of ordered request (polling).
Generally . When we have the equation of the linear or polynomial regression of the independent variable on the dependent variable , if we have a system of multiple regression equations in the variables on . (This refers to a functional and not statistical relationship.) In this problem, the independent variables are random variables, which are not necessarily statistically independent.
Variable is approximated with regression function containing parameters estimates and unknown factors evaluation . The equation of the linear regression model, the independent variables on the dependent variable can be written in the following form:
.
where e — approximation error.
Let . Then we can write the equation in the form of polynomial regression
But the cases of missing values may take place rather often. When using one-dimensional in nature methods of analysis (e.g. -test) the most sensible course of action is to remove a sample of cells with a missing setting to X (variable analysed). However, the situation varies greatly by using multivariate analysis techniques, i. d. when each element has a sample p observed variables . Now, if the sampling member has a missing value, say, for a variable , the removal of this element of the sample analysis is not necessary, since it leads to loss of information on the variables delivered by this element. Since multiple linear regression analysis, as well as other multi-dimensional procedure based on the average vector m and the covariance matrix S, the element can be left in the sample and to use its measurements to calculate estimates mean vector and covariance matrix .
However, in many applications, the regression analysis experimenter hasn’t sufficient information about the independent variables on the order of importance for the prediction of the independent variable. Hypothesis testing for each variable , doesn’t give this information. This may lead to an incorrect conclusion that only variable is important for prediction of .
Since the statistics measuring the effectiveness of a set of independent variables as predictors, serves multiple correlation coefficient, one of the solutions to the problem mentioned above is reduced to a regression on all possible subsets of independent variables and choosing the best subset according to the following procedure. Among all the subsets of variables of dimension k, k = 1, …, p, subset is selected. The largest value of the multiple correlation coefficient corresponds to that . For a subset the hypothesis that the addition of the remaining variables did not improve the prediction is tested. If this hypothesis is rejected, then checked a similar hypothesis that the addition of the remaining variables into subset also did not improve the prediction . This check is used sequentially until for some subset the hypothesis of no improvement of prediction of by adding the remaining variables accepts. A subset of the best subset of variables to predict, because firstly, it corresponds to the highest value of multiple correlation coefficient among all subsets of dimension m and secondly, adding the remaining variables did not significantly improve the prediction of . If this subset is not the only one, you should select the most appropriate subset based on the nature of the problem.
If a large number of independent variables, this approach to determine the best subset practically useless because of constraints on computer and communication recourses.
One of acceptable decisions is straight step-by-step regression when the independent variables one after the other are included in the subset according to a predetermined criterion. At the same time some variable can be replaced with another variable that is not included in the set, or removed from it. From the combination of the criteria for determining which variables include, replace, and delete, the parameters step-by-step procedure are set.
Since the parameters of the individual network nodes and elements in the process of changing operation of the network randomly, network optimisation must take into account the characteristics of the parameters on which depends on the quality of service and the relationship between these parameters. The key parameters are the transmission delay, bandwidth, packet loss and the security level. These options have the greatest impact on the resulting quality of service of the storage network.
In addition, some additional parameters can be administered as a task optimised parameters. They may be present in some systems, networks and indicators absent in others.
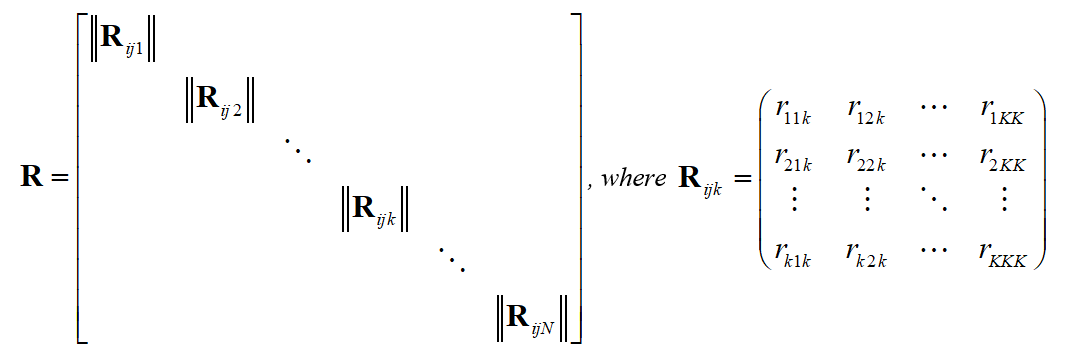
In view of the above considerations matrix of multiple correlation coefficients is a three-dimensional matrix «line — column — layer» to the following:
 is th layer of matrix .
Suppose that matrix has dimension . In addition, we assume that the process parameters are fixed at intervals of surveillance and control. Then the matrices are symmetric. These assumptions simplify the procedures of realisation and current control of polling procedures.
The results of the correlation analysis are key indicators for monitoring and control of streaming data and polling services. This is necessary to ensure the safe transfer of information over the network, predict and prevent overloads monitored network segment. Thus, the current monitoring and control of the security level of the network is an integral part of the overall quality of service management tasks.
- Conclusions
According to the analysis of the consultation process in the polling system it found that the choice of the most appropriate survey about the storage network elements depends on the size of the requested data packet. In turn, the length of the queue of requests determines the volume of the requested package. In other words, the choice is determined by the kind of distribution of the data on individual elements of data storage.
As informative parameters to select a survey about the service and the intensity of a particular queue is proposed to use an integrated component of the queue length and the speed of its growth or decrease.
Using step-by-step regression method for prediction of state of SANs we can support the balance between remaining variables and remaining number of elements of sample and thus maximise the number of full-complete elements.
In future, based on the type of transition probabilities depending on the time, enter the poll rule type «m from n» — in n cycles of the survey is carried out polls the ith queue — depending on the growth rate of the ith queue.


